Motivation
For quite some time, I follow the The Coding Train on Youtube. The delivery of the Prof. Shiffman is mind-blowing, to say the least. It is due to his videos that I got interested in p5.js and started learning it. This rendering of the Mandelbrot set is one of my first creations with this library. Although, this may not be as good as his rendering, but I wrote everything from scratch to the best of my abilities.
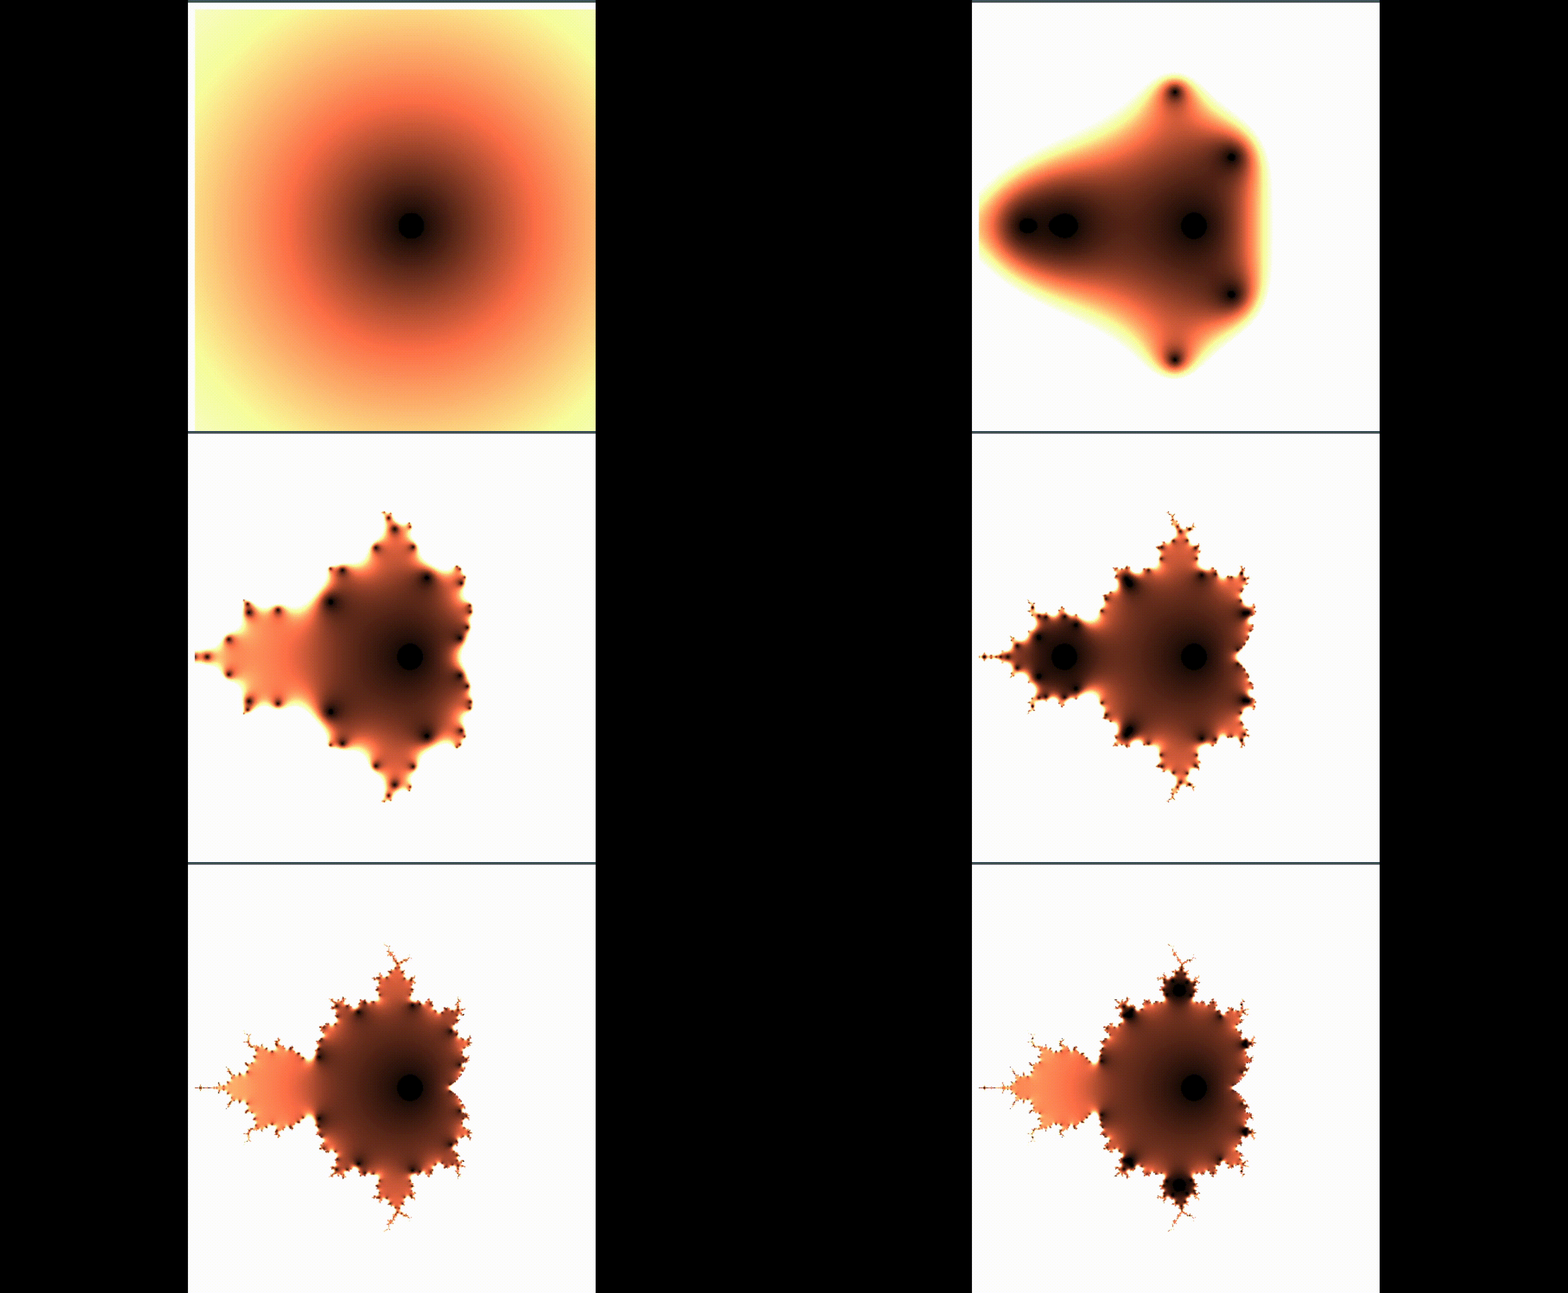
Final result achieved:

What is p5.js?
p5.js is a JavaScript library maintained by the Processing Foundation. It is a JS alternative to the Processing library for Java. Among other things, it gives fantastic drawing and rendering capabilities, both in 2D and 3D (using WebGL). We'll use the 2D drawing part of p5 in this post.
Mandelbrot Set
You need to have some basic knowledge about Complex numbers and their functions to understand the concept behind Mandelbrot set. Here's a primer:
Complex numbers are numbers of the form
Here, a is the Real Component and b is the Imaginary component.
Thus to define a complex number, we require to 2 numbers. What else requires 2 numbers to define? Yes, the points in a plane. Hence we can map each complex number to a point (a, b) in a Cartesian plane and plot the same on a Graph.
Such a diagram is called Argand diagram.
Regular algebra applies to complex numbers. So
Also for each complex number we define its modulus as a real number given by:
That's all of Complex numbers you need here.
Now let's consider a function of the Complex numbers as:
For a given c, if we form a sequence like the following:
The values of c for which the sequence remains bounded (even after infinite steps) constitute the Mandelbrot Set.
Visualization
Phew! that was quite the definition. But how do we know, what will happen infinite steps? We don't have a closed form expression for that.
Instead, we can do a little cheating and run the simulation for a fixed number of steps. Then we need to choose a threshold value. If, for a given c, the modulus of the value achieved after interating for that many steps is less than or equal to the threshold, we keep c in the set (and colour the corresponding point black) else, we reject c (and colour the corresponding point white).
This gives a plain black and white image of the Mandelbrot boundary. But to make the things more interesting, we can play with the modulus value, and use that to create a colour gradient.
Enough talk, show me the code!
We begin by creating a index.html file to import all the libraries.
<!DOCTYPE html>
<html>
    <head>
        <title>Mandelbrot Set</title>
        <meta name="charset" content="utf-8">
        <meta name="viewport" content="width=device-width">
        <script src="https://cdnjs.cloudflare.com/ajax/libs/p5.js/0.10.2/p5.js"></script>
        <script src="https://cdnjs.cloudflare.com/ajax/libs/p5.js/0.10.2/addons/p5.sound.min.js"></script>
    </head>

    <body>
        <script src="sketch.js"></script>
    </body>
</html>
Then in the sketch.js file, I begin by defining complex numbers:
class Complex{
    constructor(real, imag){
        this.real = real;
        this.imag = imag;
    }

    square(){
        let realtemp = this.real * this.real - this.imag * this.imag;
        let imagtemp = 2 * this.real * this.imag;
        this.real = realtemp;
        this.imag = imagtemp;
    }

    add(r, i){
        this.real += r;
        this.imag += i;
    }

    modulus(){
        return Math.sqrt(this.real * this.real + this.imag * this.imag);
    }

    mandelbrotFunc(r, i){
        this.square();
        this.add(r, i);
    }
}
Notice how the mathematical operations are in-place. Since to compute the Graph, I need a grid of such complex numbers, not doing it in place uses up a lot of extra memory which is surprisingly not cleaned up by the garbage collector fast. This is a little bit of optimization that I had to do.
p5.js expects two main functions to be present in the sketch.js:
- setup() which is run once.
- draw() which is run every frame
In the setup, I define the 2D grid that will hold the simulation values:
let grid;
const rows = 500;
const cols = 500;
let w, h;
function setup(){
    createCanvas(500, 500);
    grid = new Array(rows);
    for (let i = 0; i < rows; i++){
        grid[i] = new Array(cols);
        for (let j = 0; j < cols; j++){
            grid[i][j] = new Complex(0, 0);
        }
    }

    w = width / rows;
    h = height / cols;
}
Next I write the draw function:
const threshold = 0.1;
let scl = 300;
let iter = 15;
function draw(){
    background(255);
    for (let i = 0; i < rows; i++){
        for (let j = 0; j < cols; j++){
            if (grid[i][j].modulus() < threshold){
                fill(0);
            }else{
                let val = grid[i][j].modulus();
                fill(floor(val * 256), floor(val * 256 / 2), floor(val * 256 / 3));
            }
            noStroke();
            rect(i * h, j * w, w, h);
            // translate(width / 2, 0);
            if (iter > 0)
                grid[i][j].mandelbrotFunc(map(i, 0, rows, -rows, rows) / scl, map(j, 0, cols, -cols, cols) / scl);
        }
    }

    iter--;
}
The line fill(floor(val * 256), floor(val * 256 / 2), floor(val * 256 / 3)); actually defines the colour gradient.
Note that, it is not guranteed to always lie in [0, 255] range.
But if it goes beyond 255, it automatically becomes white.
It can not less than 1,
because before reaching that value, we automatically set the colour to black using the line fill(0);.
The rect function is used to draw a tiny rectangle with the specified colour for that grid.
The main variables of interest are iter and scl.
iter controls the number of steps for which to run the simulation.
I saw that 15 was a good number for a clear image.
The scl variable controls the zoom of the image.
The larger the scl, the bigger the zoom would be.
To get a satifactiory result, I set it to 300 after much tuning.
That is all for this post! Let me know your insights.